Thinking about whether your next home should be in Boston or along the South Shore? You are not alone. Many buyers want city convenience but also crave more space, a yard, or better value for the money. In this guide, you will learn how prices, inventory, appreciation, housing types, and commutes compare so you can choose with confidence. Let’s dive in.
Price trends at a glance
Boston’s core neighborhoods typically post the highest prices per square foot, with tight inventory for the most in-demand homes like condos and walkable brownstones. Quincy generally sits in the middle on pricing, especially in areas close to the Red Line and commuter rail. Farther South Shore and many Norfolk County suburbs often offer lower median prices and lower price per square foot, though commute times are usually longer.
Price per square foot differences
- In Boston, you often pay a premium for location, walkability, and historic housing stock. Units are usually smaller, which pushes up price per square foot.
- In Quincy, you tend to see more space for the budget compared with central Boston, especially in neighborhoods near transit like Quincy Center, North Quincy, and Wollaston.
- In many South Shore and Norfolk County towns, larger lots and single-family homes are common. Buyers usually get more interior space and yard for the price.
Appreciation patterns and volatility
- Over long horizons, central Boston has historically shown strong price appreciation, supported by limited land, a strong job base, and steady demand.
- Since 2020, demand for more space lifted prices in many suburbs. Towns with reliable Red Line or commuter rail access, including Quincy, Braintree, and Weymouth, generally performed well compared with more car-dependent areas.
- Small micro-markets can move more sharply from year to year. High-end suburbs or niche condo markets may see bigger swings in percentage terms.
Inventory and days on market
- Boston often has very limited supply in desirable condo and townhouse segments. That can fuel multiple-offer scenarios when demand is hot.
- Suburbs usually have more single-family options, but availability varies by season and development activity. When rates rise or demand cools, some suburban markets can see inventory build faster than dense urban districts.
Value for money: space, taxes, and costs
When you compare price tags, it helps to think in terms of usable space and total carrying cost.
Housing mix and size
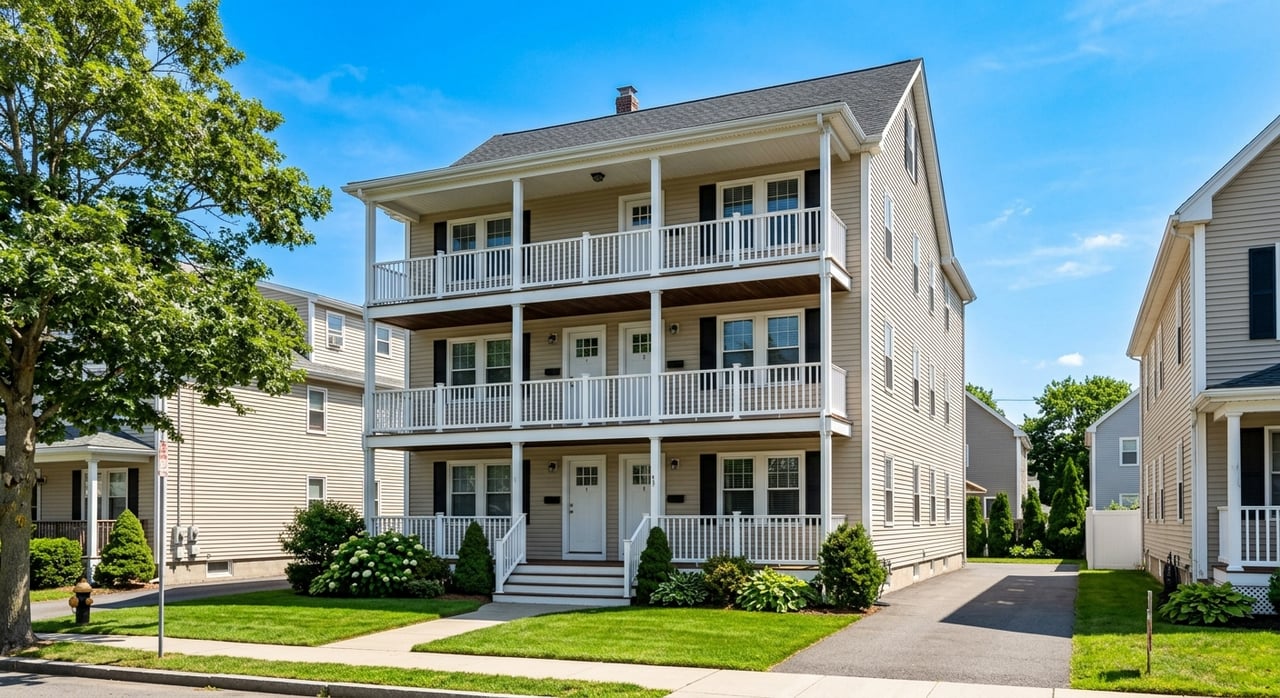
- Boston: A higher share of condos and multifamily walk-ups with limited single-family options in central neighborhoods. Expect smaller units and higher price per square foot.
- Quincy: A balanced mix of condos, multifamily, and single-family homes. For many buyers, Quincy offers larger units and a yard at prices lower than central Boston.
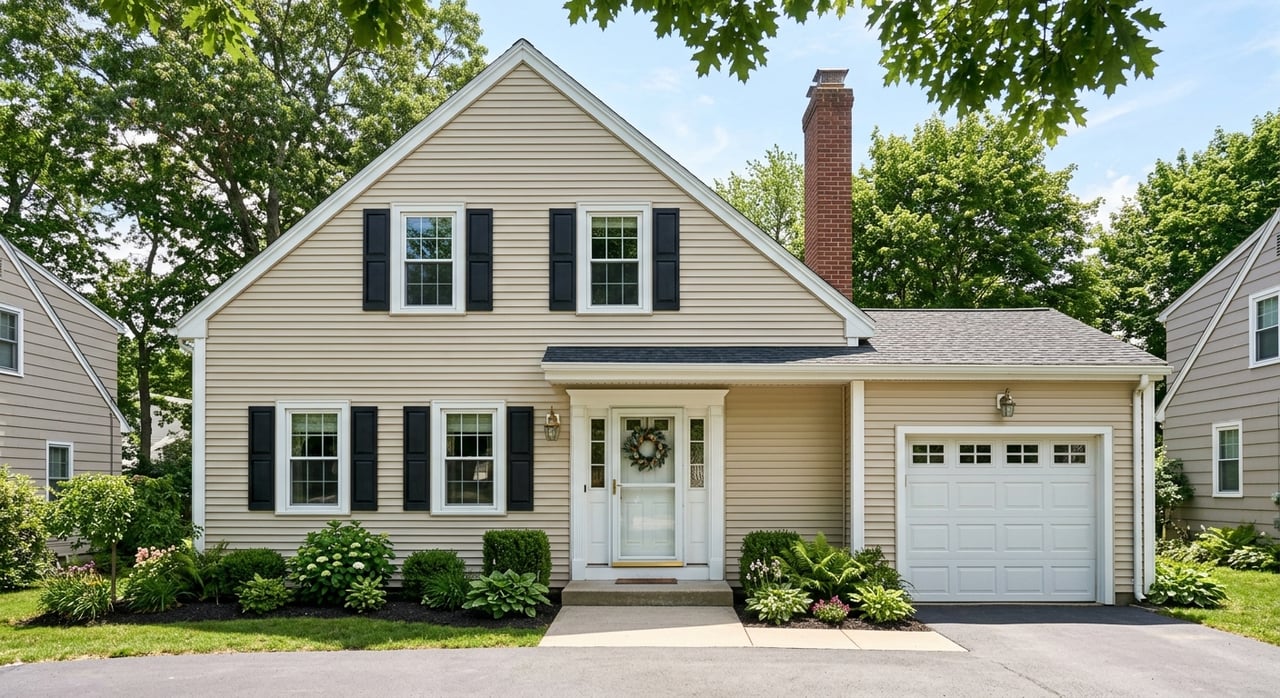
- South Shore and Norfolk suburbs: More single-family homes on larger lots. You will often find colonials, ranches, and newer subdivisions in some towns.
Price per square foot vs. total space
Price per square foot can be helpful, but it can also mislead. A small luxury condo downtown may show a very high number, while a larger suburban home looks far cheaper on a per-foot basis. Consider finished square footage, bedroom count, and the lot when you compare value.
Property taxes and ownership costs
Massachusetts property tax rates vary by city and town. Effective tax costs depend on both the local rate and the home’s assessed value. In Boston, values are higher, but the tax rate may not be the highest in the region. In the suburbs, you may pay for more land and a larger home, and you should plan for higher utility and maintenance costs due to size.
If a condo is on your list, factor in association fees. In the city and in parts of Quincy, condo fees cover shared systems, exterior maintenance, and amenities. In the suburbs, single-family owners should plan for lawn care, snow removal, and repairs that a condo fee might otherwise cover.
Renovation and permitting
Renovating in Boston can be complex due to historic district rules, dense lots, and limited land. Suburbs often have more options for additions, garages, or even new construction on available parcels. Coastal and open-space protections still apply in many South Shore and Norfolk County towns, so always check local zoning and conservation requirements.
Commute and transit trade-offs
Access to transit is a major difference maker when you compare city and South Shore living.
Transit coverage overview
- Boston: Extensive MBTA coverage with subway, bus, and commuter rail. Many neighborhoods are highly walkable with short hops to job centers, restaurants, and services.
- Quincy: Multiple Red Line stations and commuter rail access offer an efficient ride into South Station and Downtown. Quincy stations typically put you roughly 10 to 20 minutes from central Red Line hubs, followed by Red Line ride times into the core.
- South Shore and Norfolk suburbs: Coverage varies. The Greenbush Line serves some coastal South Shore towns, and many Norfolk County towns have commuter rail or express bus options. Some areas require a car for the last mile to a station.
Parking, car ownership, and cost
In Boston, garage parking can be pricey and street parking limited, especially in dense neighborhoods. In the suburbs, most households plan on at least one car. Budget for fuel, insurance, and maintenance along with your housing costs.
Neighborhood and town snapshots
Use these examples to gauge fit. Every micro-market is different, so always compare at the neighborhood level.
Boston examples
- South End and Back Bay: Classic brownstones and strong walkability. Higher price per square foot, smaller average unit sizes, and strong long-term demand.
- Seaport: Newer luxury condos with premium amenities, very high price points, and quick access to job centers.
- Jamaica Plain and Dorchester: More varied housing stock. Prices and price per foot are usually lower than in the core luxury districts, with differences block by block.
Quincy neighborhoods
- Quincy Center: Transit-oriented with restaurants, services, and ongoing redevelopment. A popular spot for buyers who want a lively node and a straightforward ride into Boston.
- North Quincy and Wollaston: Red Line access, a mix of condos, multifamily, and single-family streets. Often a sweet spot for price, space, and commute.
- Adams Shore, Merrymount, and Germantown: More neighborhood feel with coastal access in some areas. Compare flood risk and insurance needs where applicable.
South Shore and Norfolk County
- Braintree and Weymouth: Strong transit links and a broad mix of housing. Often competitive due to commute options and relative value.
- Hingham and Cohasset: Higher-end coastal towns with premium pricing in many areas. Lifestyle amenities and coastal access are key draws.
- Scituate, Marshfield, Norwell, Plymouth: Generally more space and yard, with a mix of coastal and inland settings. Commutes vary by location and mode.
- Norfolk County options like Needham, Westwood, Canton, Walpole, Sharon, Dedham, Norwood, Stoughton: Many have commuter rail access and established single-family neighborhoods. Pricing reflects proximity to major job corridors and local demand drivers.
Lifestyle and risk considerations
Amenities and environment often tip the scales once you narrow your budget.
- Walkability and nightlife: Boston wins for density, dining, entertainment, and cultural institutions. Quincy offers several walkable nodes, and the South Shore leans toward parks, beaches, and open space.
- Schools and activities: Many suburban buyers prioritize school systems, youth sports, and access to fields and parks. Keep your comparisons neutral and data-driven as you evaluate options.
- Coastal exposure: Some South Shore communities face flood risk in certain areas. Review FEMA flood maps and local rules to understand insurance and elevation requirements before you buy near the water.
A simple framework to choose your best fit
Use this checklist to balance budget, space, and daily life.
- Budget vs. space: Do you prefer smaller space in a prime, walkable location or more interior square footage and a yard for the same budget?
- Commute: Are you relying on the Red Line or commuter rail, or will you drive most days? What is your tolerance for a longer, variable commute?
- Housing type: Condo with shared amenities, or single-family with private outdoor space and more maintenance?
- Carrying costs: Condo fees vs. utilities and upkeep for a larger home. Compare property taxes by town and home value.
- Renovation flexibility: Do you plan to add on or build? City permitting is tighter, while many suburbs offer more room to expand, subject to local rules.
- Risk factors: If you want a coastal lifestyle, factor flood exposure and insurance into your decision.
What this means for buyers right now
- If you value walkability and a shorter transit commute: Boston’s core may be worth the premium. Expect smaller homes and strong competition for the best condos and townhomes.
- If you want more house without giving up transit: Quincy is a frequent best-of-both choice. You typically get more space than central Boston and keep a manageable ride into the city.
- If your priority is maximum space and a yard: Many South Shore and Norfolk County suburbs deliver more interior square footage and lot size for the price, with a longer commute and more car dependence.
How RockHome helps you compare
Choosing between Boston, Quincy, and the South Shore is personal. You deserve clear, local advice and a smart plan. RockHome pairs neighborhood expertise with premium digital tools to help you compare options quickly and act with confidence. We will walk you through price trends, inventory, commute routes, and the total cost of ownership for homes on your shortlist.
Ready to see data tailored to your search and tour the right homes? Reach out to Alex Rocher for a consult, an instant valuation, and a custom list of listings that match your goals.
FAQs
Which area gives the most space for the money?
- Many South Shore and Norfolk County suburbs offer the most interior and lot space per dollar; Quincy sits between central Boston and outlying suburbs on space and price.
Is Quincy a good compromise for space and access?
- Yes. With multiple Red Line stations and commuter rail access, Quincy often delivers more space than central Boston while keeping a manageable commute.
Will Boston always appreciate faster than the suburbs?
- Not always. Boston tends to hold value strongly over long periods, but well-connected suburbs with strong local demand can appreciate quickly in certain cycles.
How much longer is the commute from the South Shore?
- It depends on the town and mode. Expect longer average drive times from more distant towns compared with Quincy and central Boston, with variability at peak hours.
Are coastal South Shore towns riskier because of flooding?
- Some areas have higher flood exposure. Review FEMA flood maps and local guidance to understand insurance needs and elevation requirements for specific properties.